|
The proposed algorithm is based on the linear image features analysis
(we call those features "stripes"). LESSA automatically
detects stripes and determines their direction (8 directions). Features
detected as stripes must be straight and long enough. In a grey
tone image homogeneous region edges (and/or grey tone lines) are
detected as "stripes".
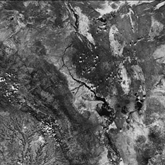
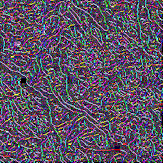
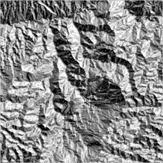
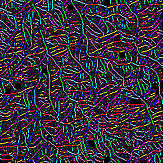
In DTM ridges and valleys axis are detected. (Automatic drainage
network detection and analysis is also possible.) It’s important
to notice that all stripes detected in DTM resemble only relief
features (not vegetation or artificial features).
There are two different methods of the stripes analysis that provide
quite different results - statistical analysis and the long linear
lineaments detection. Statistical analysis is the most developed
and objective method. Total number of the stripe pixels of each
orientation is calculated in the given neighborhood and displayed
by so called rose-diagram (or simple, rose). This data is calculated
either in the user defined neighborhood (blocks) or in the picture
point neighborhood (the circular scanning window). As a matter of
fact, rose-diagrams represent orientation image (texture) properties.
The scanning window calculations form large matrixes (we call them
"digital fields") of each orientation density and of roses
shape descriptors such as elongation, crusiformance, neighborhood
rose difference and others. One can analyze digital fields visually
- they are displayed as pseudocolored images - looking for sharp
gradient and anomalous zones. Digital fields are used also for decision
making in GIS (examples).
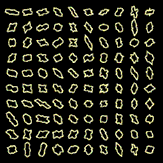
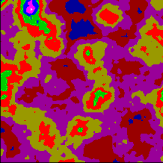
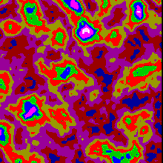
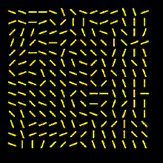
The scanning window results are displayed also by
"drawing fields" such as rose-diagrams, vectors of the
rose-diagrams elongation, vectors of the rose-diagrams maximal direction
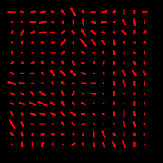
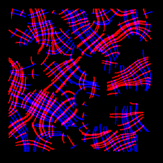
and so on. Main orientation texture features are presented in LESSA
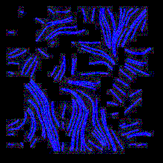
by so-called orientation net ("OR-net") - lines along
roses elongation (blue lines) and across elongation (red lines).
Several "drawing fields" could be displayed simultaneously
and along with any "digital field" or other image.
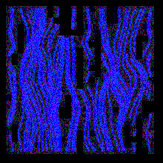
Several LESSA tools help user to achieve meaningful,
"readable" results. For example, if there is one major
stripes direction in the image that masks all local orientation
features, one can use so called "global normalization"
to extract these local features.
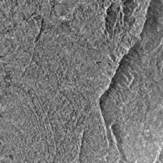
Regarding the long lineaments detection, the stripes detected at
the first step are combined into the straight lines - lineaments.
There could be gaps between the stripes but the lineaments must
be straight and long enough. Validity measure shows how good lineament
is filled with stripes. User can display lineaments of the given
direction and "validity", select them and combine into
a lineament scheme. User chooses lineaments for the scheme himself,
subjectively, but he chooses among lineaments that are detected
by formal criteria, objectively. User can find lineaments that he
did not detect in the image himself; he can also examine lineaments
structure (stripes that form it). User can change calculation accuracy
to find optimal time-accuracy relation.
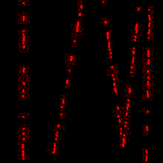
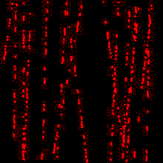
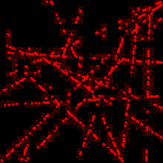
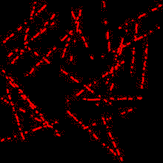
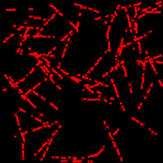
It’s very important to seek lineaments of the proper length (not
too long), to take into consideration lineaments and stripes length
relation. Some times it’s better to look for shorter lineaments
that do not cross the whole image. It’s easy to see that shorter
lineaments (3 and 6 times in the given example) can form somewhat
different schemes.
|