|
Program LESSA - Lineament Extraction and Stripe Statistical Analysis
- automatically extracts linear image features and analyzes their
orientation and spatial distribution. LESSA provides picture (texture)
description in the way common for the geological research: rose-diagrams,
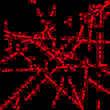
densities of features with certain orientation, schemes of long
lineaments, and several new descriptors of the rose-diagram features
are also provided: vectors and lines of elongation, local rose diagrams
difference and the others.


LESSA methods could be applied to different types of data - gray
tone image, binary schemes (drainage network, for example), digital
terrain map (DTM) - giving territory description in a common way
(lineament analysis algorithms details ...).
LESSA provides researcher with the objective data that can assist
in decision making. Provided information can be used for the interactive
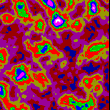
analysis (lineament schemes, rose-diagrams, pseudocoloured density
images) and for automatic analysis (in GIS).
LESSA gives an opportunity to compare orientation information that
was obtained for the given territory: from different spectral zones,
different date etc.
LESSA was intensively used for about 25 years, so image
analysis algorithms reliability and lineament
analysis methodological problems were examined.
How to analyze LESSA results one can find in the South-West Africa
image processing example.
LESSA uses advantages of special image processing systems and hardware
(versions).We have experience in adopting
LESSA for such systems and in developing new specials tools.
LESSA - its program structure and lineaments
analysis applications - are described in printed articles and
Internet recourses.
One can get more information about LESSA testing it with his own
data and/or use free distributed version.
|